
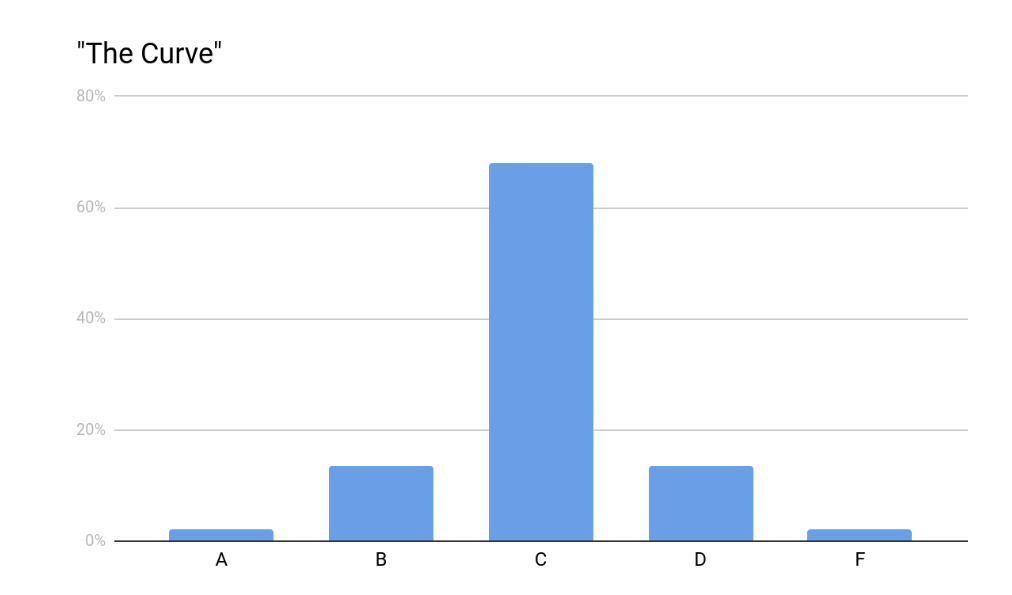
We have all been in a class, either in college or in high school, where students who performed poorly on a test were overjoyed when the instructor announced he was “grading on a curve.” Somehow, through the magic of mathematics, the instructor performed an incantation that rocketed poor test performance to a passing grade. The magical incantation resulted in a few A’s (2.1%), many B’s (13.6%), a lot of C’s (68%), many D’s (13.6%), and a few F’s (2.1%) -- or in other words, a bell-shaped curve.
Hidden in the instructor’s incantation was a belief that a bell-shaped curve represented the proper distribution of grades, and, more generally, the world. While the bell curve does frequently appear in statistics and physics -- often associated with measurements -- it is not the only game in town.
Let’s imagine that there is a school for criminals, where each criminal gets a grade. We will call these grades “charges.” You might imagine that grades in the school of crime would resemble the bell-shaped distribution of grades in English Literature, but you would be wrong. Instead, in crime, there are a very small number of individuals who generate massive numbers of criminal charges (“A’s”). These A-students are the Tony Sopranos or the Pablo Escobars of the underworld. On the other hand, the vast majority of criminals only ever have one charge. These F-students commit one crime and then return to a law-abiding life.

(Data from The Power Distribution as a Model for Criminal Careers)
As the graph above demonstrates, there is no bell curve in the school of crime. A few criminals commit most crimes, while most criminals commit few crimes. In mathematics, such a distribution is known as a power law.
When I lived in Los Angeles, the power law was very evident. It seemed like half of LA was trying to be the next big star. Even my hair salon -- I did have hair at the time -- was a haunt for would-be movie stars. These aspiring actors and actresses auditioned for any and every part, made no money, and were supported by minimum-wage jobs or their families. On the other hand, a handful of big stars, like Brad Pitt, raked in tens of millions of dollars per year. This is the power law. A few A-list stars live like kings, while millions of F-list stars -- if there is such a thing -- barely get by. The same power-law distribution occurs with models: look at how much Gisele Bundchen makes compared with everyone else.

(Figure from Power Law in Popular Media)

(Data from Forbes Releases 2014 Highest-Paid Models List)
As with mob bosses, movie stars, and models, power laws pop up in many other areas. Power laws have been discovered in astronomy, criminology, physics, biology, meteorology, mathematics, the internet, and of course, economics. Indeed, power laws seem to be a fundamental part of the fabric of our world. While the bell curve typically occurs when things are being measured, by contrast, power laws typically occur in situations driven by network effects, positive feedback loops, and popularity.
The internet and artificial intelligence have made power laws more and more important to finance. Consider Google. Back in the 1990’s, there were dozens of search engines to choose from: AltaVista, Ask Jeeves, Excite, Infoseek, Lycos, Yahoo, WebCrawler, etc. These engines were very basic, but they could generally find what you wanted. In 1998, Google appeared. While the old engines used simple algorithms to perform a search, Google used intelligent algorithms. As people used Google to search, Google used the user’s behavior to train its search algorithms, which made its search better, which caused more people to use Google’s search, which provided more user data, which made its search better, and so on. After a few years of this virtuous cycle, Google was effectively the only game in town for search. You can see similar feedback cycles in other internet businesses, like Facebook or Airbnb.
Some forward-looking companies are very aware of our new winner-take-all power-law economics. Uber and Lyft are in the midst of a money-burning bonanza to be the big winner in the ride-sharing business. It is simple. If you need a ride, you will use the platform with the most drivers, and if you are a driver, you will use the platform with the most riders. The reality of network effects and the power law makes it tough for more than one ride-sharing business to excel.
Similarly, Amazon, Google, and Microsoft are all desperate to win at cloud computing. The more developers a cloud platform has, the more money the platform can spend to provide new features, which brings more developers to its platform, which pays for new features, and so forth. Once again, a virtuous cycle is at work.

(Data from Top Cloud Vendors Will Crush $100 Billion In 2018 Revenue; Microsoft, Amazon, IBM Hit $75 Billion?)
As interesting as this discussion is, does it apply to investing? Absolutely. The next time you consider investing in a company, ask yourself: does this business exist in an industry that grades on a bell curve, where a “C” is just fine? Or, does this business compete in an area that grades on a power-law curve, where the winner takes all, and only the best mobster or movie star thrives?
David R. “Chip” Kent IV, PhD
Portfolio Manager / General Partner
Cecropia Capital
Twitter: @chip_kent
Nothing contained in this article constitutes tax, legal or investment advice, nor does it constitute a solicitation or an offer to buy or sell any security or other financial instrument. Such offer may be made only by private placement memorandum or prospectus.